 1.
Gross Chromosomal Similarities
 1.
Gross Chromosomal Similarities
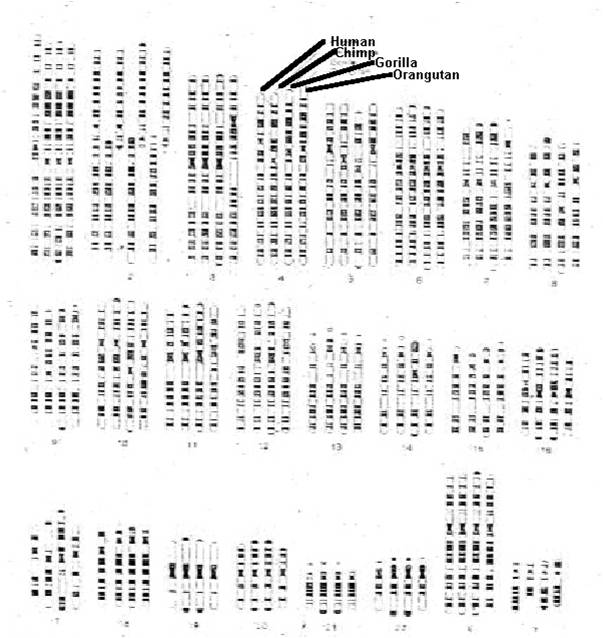
The most definitive tests of biological relatedness come by examining DNA. Why? Because the only place an organism gets its DNA is from its parents, their parents, their great-grand parents, and their ancestors. Barring the rare events of lateral gene transfer that can occur in some organisms, the only reason two organisms would have similar DNA is that they are biologically related. So, If I am accused of fathering a child, and my DNA is similar to that child's DNA, then I can be "convicted" of being related to that child. That is the only reason two organisms will share DNA - because they are biologically related. This pattern is reinforced by our understanding of meiosis and sexual reproduction, which explain why these patterns of relatedness occur. Now, when we see similarities among species in DNA structure, logical consistency demands that we propose the same hypothesis for the same pattern. In the figure at right, you see the chromosomes from a human, a chimp, a gorilla, and an orangutan. The most striking thing is the similarity in banding patterns across these chromosomes. Remember what those bands signify? The dark areas are heterochromatin, that have a low concentration of coding sequences. The lighter areas are euchromatin, where most of the genes are. So, we are looking at similarities in the large scale architecture of the genomes from these organisms. Evolutionary theory predicted that humans would have similar DNA to apes, and they do - even at the level of gross chromosomal structure. However, there is a major difference here; humans have n=23 while the other species have n=24. How can evolutionary biology explain this difference in chromosome number? Well, even the exception here proves the rule. The long #2 chromosome in humans - the first chromosome in thes econd set of chromosomes in the upper left corner of the figure - is banded like two of the chromosomes in other primates (shown next to it). A simple hypothesis would be that, at some point in the human lineage after divergence with chimp-like ancestors, these two chromosomes fused and became inherited as one unit. Can you remember an instance where chromosomes get stuck together and inherited as a single unit? It happens in translocation events, like in translocation Downs. And of course, this is not always deleterious to the organism - carriers for the translocation chromosome are phenotypically normal. A mating between two carriers could produce an offspring with the correct DNA content, but with two fewer chromosomes. Apparently, just such a modification may have occurred in the human lineage after divergence for the common ancestor we share with chimpanzees.
2. Mutational clocks
Mutations occur over time; the longer populations diverge from one another, the more mutational differences should accumulate between them. Many mutations have little effect on the phenotype - indeed, mutations in the non-coding intron regions of a gene, or in non-coding sequences between genes, have no effect on the phenotype. These mutations will be selectively neutral - and they should accumulate at a steady rate over time. If we can measure the mutation rate, then we can use this rate like a 'clock': we can count the number of mutational differences there are between the DNA from differnt populations, and then compute how long they must have diverged from one another to account for the genetic difference that we see.
3. Genetic Phylogenies
 Because
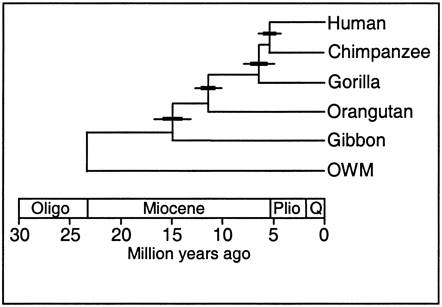
DNA comes from ancestors, similarity in DNA implies common ancestry. The greater
the similarity, the less time since their common ancestor; in other words, the
more "recent" their common ancestry. For example, human DNA and chimp
DNA is 98.4% similar in nucleotide
sequence, so they share a more recent common ancestor than either species shares
with gorillas - which are similar to both humans and chimps at a rate of 95%.
Now, some might claim that these similarities are analogous, representing
similarities between organisms that function in a similar way (but are not biologically
related). But, only 10% of the genome is a recipe for protein. Even
the 90% that does not code for protein, that is random sequence, still shows
this similarity. Even non-functional DNA is similar, so functional similarity
(ie., ANALOGY) can't be the answer... the similarity must be HOMOLOGOUS - the
result of common ancestry. Genetic phylogenies have been a powerful tool for
reconstructing the evolutionary relationships among broad categories of organisms
that are very different or similar morphologically. So, for instance, biologists
had long believed that all prokaryotes were closely related to one another,
and not closely related to the eukaryotes. Genetic analyses revealed, however,
that the Archaeans were more closely related to eukaryotes than to the other
prokaryotic group, the eubacteria. Likewise, genetic analyses show that fungi
are more similar to animals than they are to plants, and green algae is more
similar to plants than they are to other forms of algae. These relationships
can be understood in an evolutionary context. The eukaryotes evolved from a
type of prokaryote - and so should be more similar genetically, to this parental
stock of prokaryotes (the archaeans) than other prokaryotes (eubacteria). Green
algae gave rise to terrestrial plants, and so should be more similar, genetically,
to this closely related group (plants) than to other algal groups. This new,
more realistic view of the history of life is reflected in a new way to classify
organisms - based on common ancestry rather than common morphology, alone. For
example, as described above, some reptile groups are more similar to birds than
to other reptiles, and some reptile groups (though extinct) are more similar
to mammals than other reptiles. The new classification scheme takes a more systematic
approach, and groups organisms based on their phylogenetic relationships (grouping
crocodilians with their close relatives the birds, for instance), rather than
grouping organisms based on shared primitive characteristics (grouping crocodiles
with turtles, snakes, and lizards in "the reptilia" because they have
scales and lay shelled eggs). We will take a look at this later in the course.
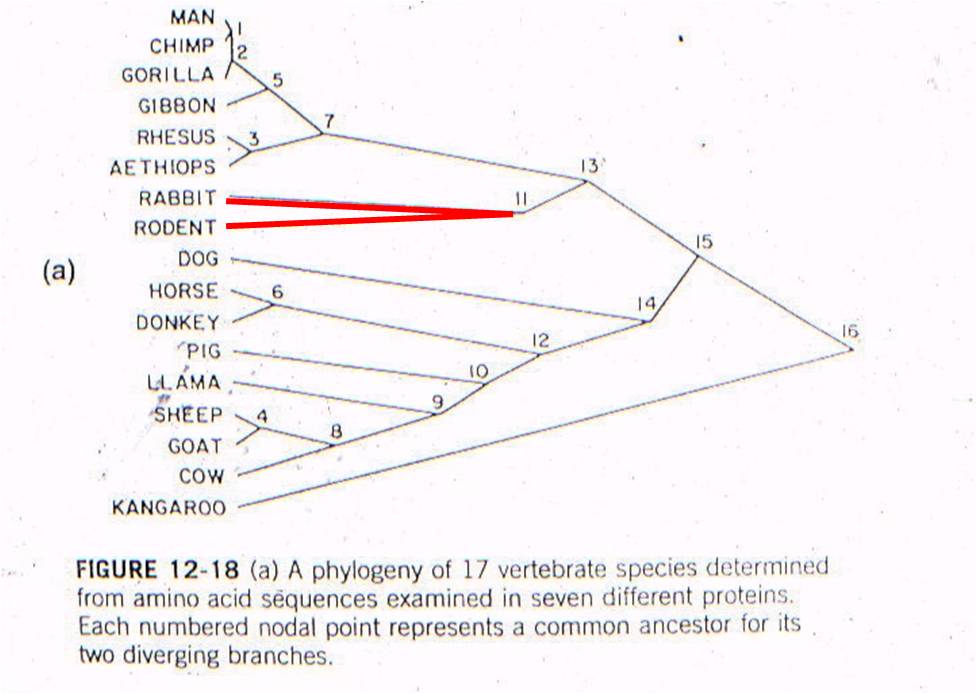
Both the fossil record and the pattern of genetic similarity among living species are presented as evidence of evolution and descent from common ancestors. If BOTH patterns due to the same phenomenon (common descent), then their patterns should be the same. In short, there should only be one tree of life, and both patterns should reveal that same tree. Indeed, we should be able to test the theory of evolution yet again, in a most remarkable way: we should be able to use the degree of genetic divergence to predict where (really "when"), in the sedimentary strata of the earth's crust, the common ancestor of two groups should be. Then, we should be able to go to that strata and find that common ancestral species.
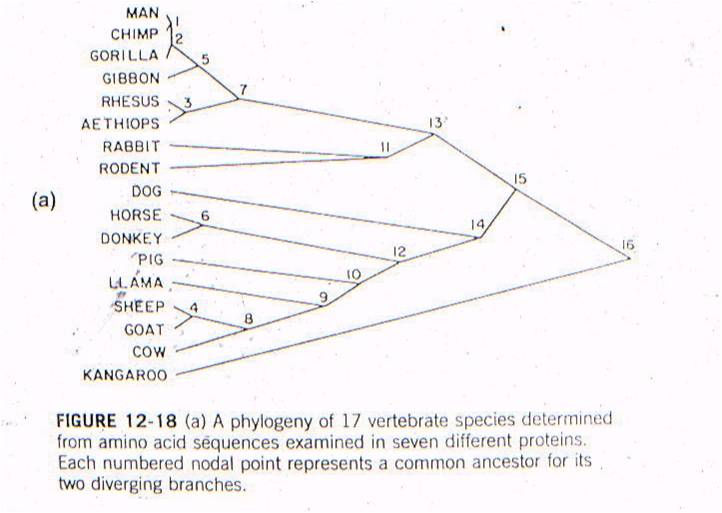 Let's
see an example of this type of test. All vertebrates have many of the same proteins,
but these proteins can differ in specific amino acid sequence. In this case,
the amino acid sequences for the same 7 proteins were sampled from 17 mammals.
For each possible pair of species, the minimum number of nucleotide substitutions
in the DNA, needed to explain the differences in the amino acid sequences, were
determined. For example, suppose humans have an argenine as the third amino
acid in collagen, while cows have lucine. Argenine is encoded by the codons
CGU, CGG, CGC, and CGA. Leucine is eoncoded by the codons CUU, CUG, CUC, and
CUA. So, although a two-base change could be responsibile (from CGU to CUA),
the minimum number of substitutions would be 1 - with just a change in the second
position (CGU to CUU). So, the minimum number of substitution mutations necessary
to explain all the sequence differerences between every pair of species is computed,
and then species are linked together based on sequence similarity. The number
at each "node" refers to the order of the clustering. So, the most similar pair
of species, of all the possible pair-wise combinations among these 17 mammals
(255 pairwise combinations) is humans and chimps - they are linked at 'node
1'. Then, gorillas are more similar to humans and chimps than any other
pair of taxa, so gorillas link to humans and chimps at node 2. Then, the
next most similar pair of taxa are Rhesus monkeys and Aethiops monkeys, linked
at node 3, and so forth. All placental mammals link together with one
another before any link to the sole marsupial, the kangaroo.
Now, this is just a clustering
procedure. It could be done on cars, nuts and bolts, anything. But
since it is done on life forms, we can test an evolutionary prediction.
Evolution suggests that organisms are similar because of common descent from
shared ancestors - represetned by these nodes. Species that are more similar,
genetically, should have a more recent ancestor than organisms that are more
different, genetically. So, there should be a relationship between 'time
since divergence' and 'genetic difference', as we explained above (mutational
clocks). Well, using the group of organisms that we have, we can describe what
evolution predicts that relationship should be:
IF: the oldest mammal in the fossil
record is ancestral to all more recent mammals, and
IF: the most different groups of mammals today (placentals and marsupials) are
descended from that ancestor, and
IF: the accumulation of genetic differences (mutations) occur at a constant
rate,
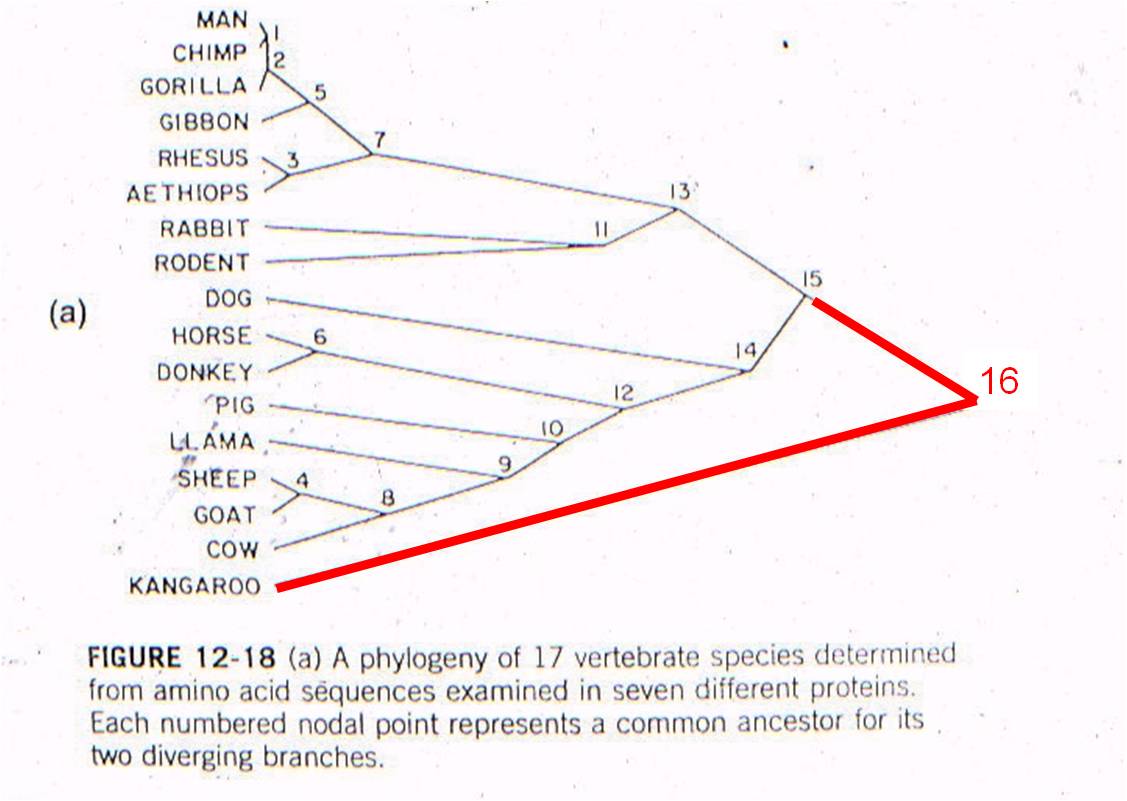
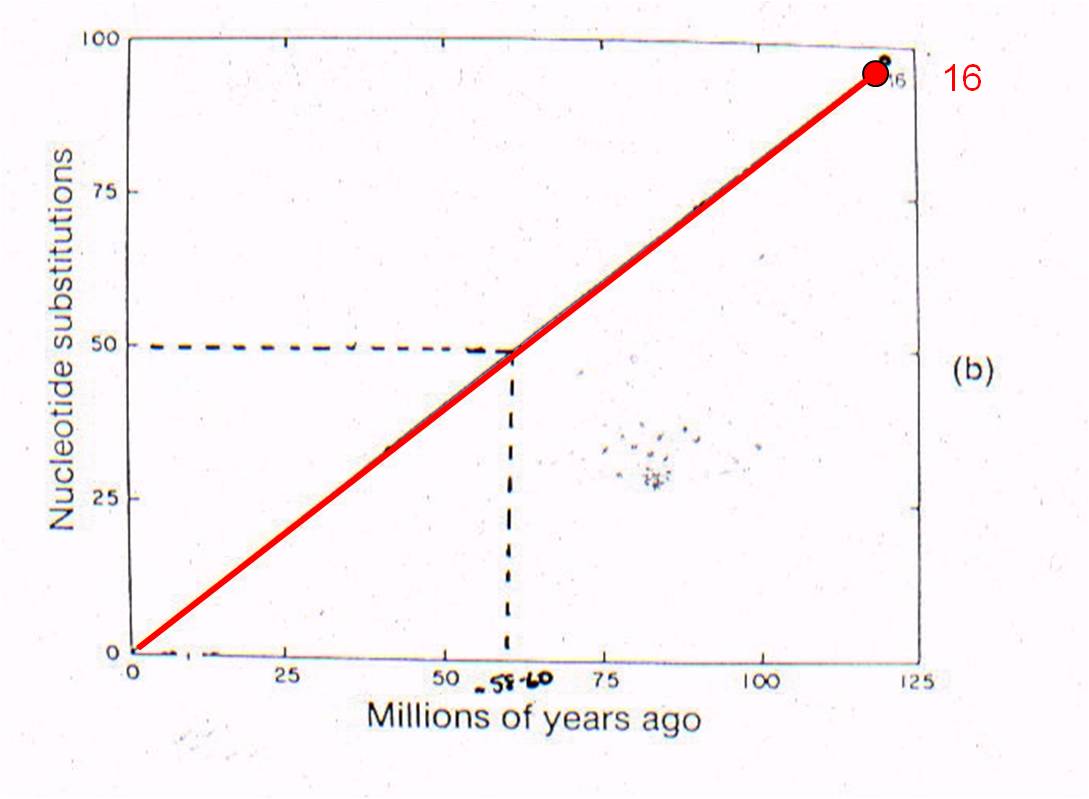
THEN: We can plot 'node 16' based on the age of the oldest mammal fossil (120 mya) and the genetic difference measured between marsupials and placentals (98 substitutions in DNA).
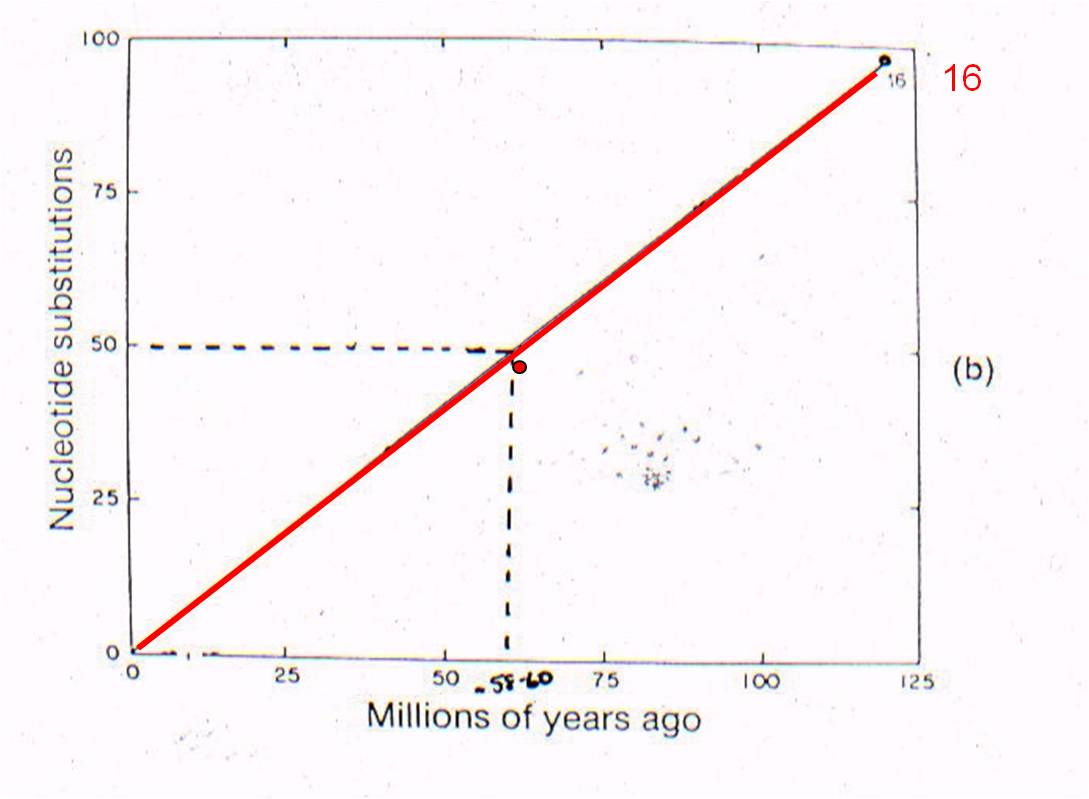
AND: if mutation rate is assumed to be constant, we can draw a straight line from 'node 16' to the origin. This is the predicted relationship between genetic similarity and time - predicted by the theory of evolution by common descent and the assumption of a constant mutation rate. So, evolutionary theory predicts that, if two mammals differ by 50 substitutions in these seven proteins, then it must have taken 58-60 million years for these differences to accumulate. In other words, their common ancestor should have lived 58-60 million years ago.
 |
 |
Well, rabbits and rodents differ by 50 substitutions in the DNA. Our model predicts that the common ancestor should live 58-60 million years ago. Well, where ARE the presumed ancestors in the fossil record? They are in strata that date to 58-60 million years old - just where the genetic analysis of LIVING species predicts they should be (see node 12, below).
 |
 |
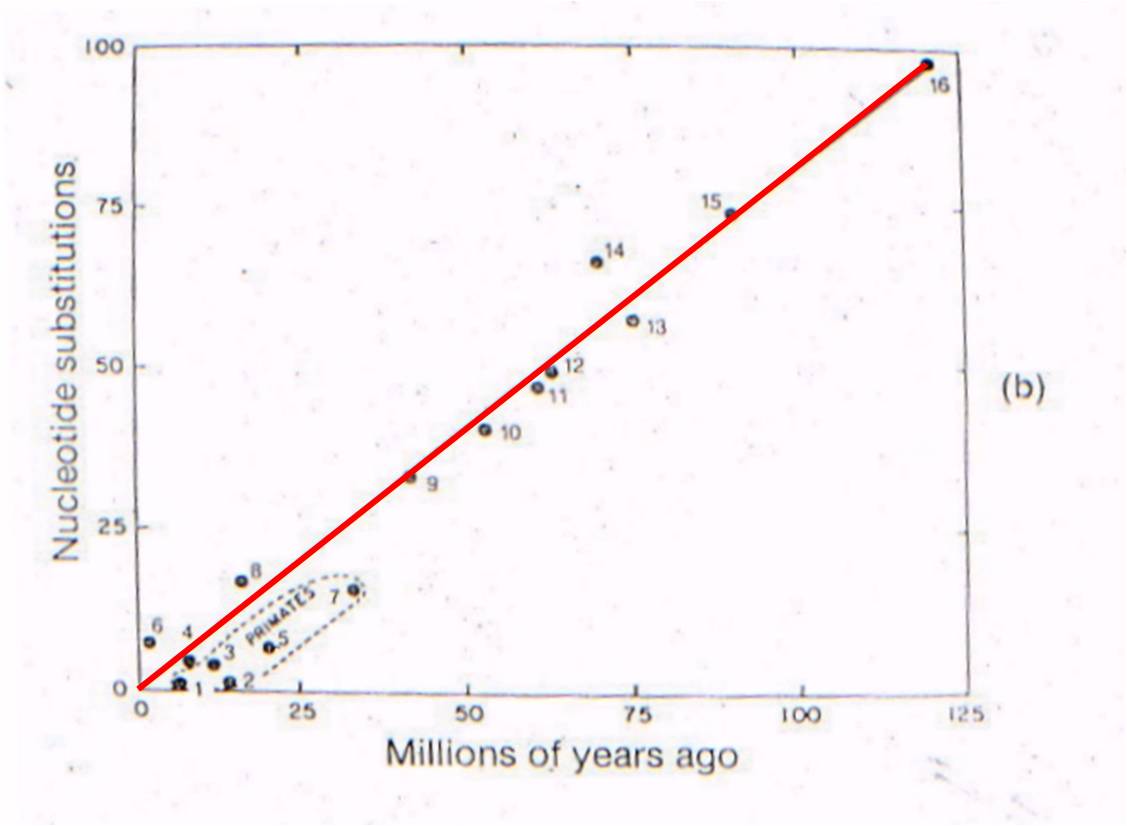 Now
lets consider where all the ancestral fossils are (figure to the right). The
intermediate fossils that link these taxa, and represent these numbered nodes,
are pretty much where our genetic analysis of existing species predicts they
should be - very close to the line. There is some variation - not all
points are exactly on the line - but our assumption of a constant mutation rate
is probably not explicitly correct for all genes, and probably introduces some
slight source of error. None the less, the data is strongly supportive
of our hypothesis - our evolutionary prediction has been confirmed by the data.
So, as we have seen before, evolution not only predicts the existence of common ancestors, but genetic analyses of living species can predict WHEN, millions to hundreds of millions of years ago, these different, extinct, ancestral species lived. (Remember those intermediate fossils? It's not just that they have a combination of traits, but they existed at the right time. Now we see genetics showing the same thing, in a PREDICTIVE way, like an good scientific theory should).
The only rational explanation that explains our ability to do this is evolution from common ancestors. This wouldn't work if evolution was false, radiaoctive dating was false, or genetic analyses did not reflect biological relatedness. All these hypotheses are confirmed by these experiments. Evolution is a predictive, explanatory model for how the universe works. It has been tested and supported in an extraordinary variety of ways.
Recognizing that natural selection and genetic drift were the two primary agents of evolutionary change, Ernst Mayr suggested that evolution would be particularly rapid when both of these agents were acting together - such as when small populations became isolated in a new environment. He thought that this would be happening quite frequently along the periphery of a species' geographical range, with small number of colonists becoming isolated from their ancestral populations in new habitats where they would be subject to new selective forces. He called this type of speciation "peripatric speciation".
In the 1970's, Stephen J. Gould and Niles Eldridge were paleontologists at the American Museum of Natural History. They were familiar with the inconsistency between Darwinian selection, which was often portrayed as a gradual, 'uniformitarian' process, and the pace of change in the fossil record. Although many lineages showed the type of gradual change that Darwin described, other lineages showed something quite different - long periods of morphological stasis interrupted by rapid periods of change. In short, they considered Darwin's last outstanding dilemma - why did the fossil record appear discontinuous, even where there were identified intermediates? In other words, even for lineages where intermediates were found, some species showed long periods of duration and others, seemingly associated with bursts of evolutionary radiations, appeared for a short time in local areas. Eldridge and Gould called this pattern 'punctuated equilibrium', suggesting that the typical lineage consisted of species that maintained long periods of morphological stasis (equilibrium) that were punctuated by rapid change. Changes were followed by descendant species that maintained their morphology unchanged for another long period.
 C.
A Resolution
C.
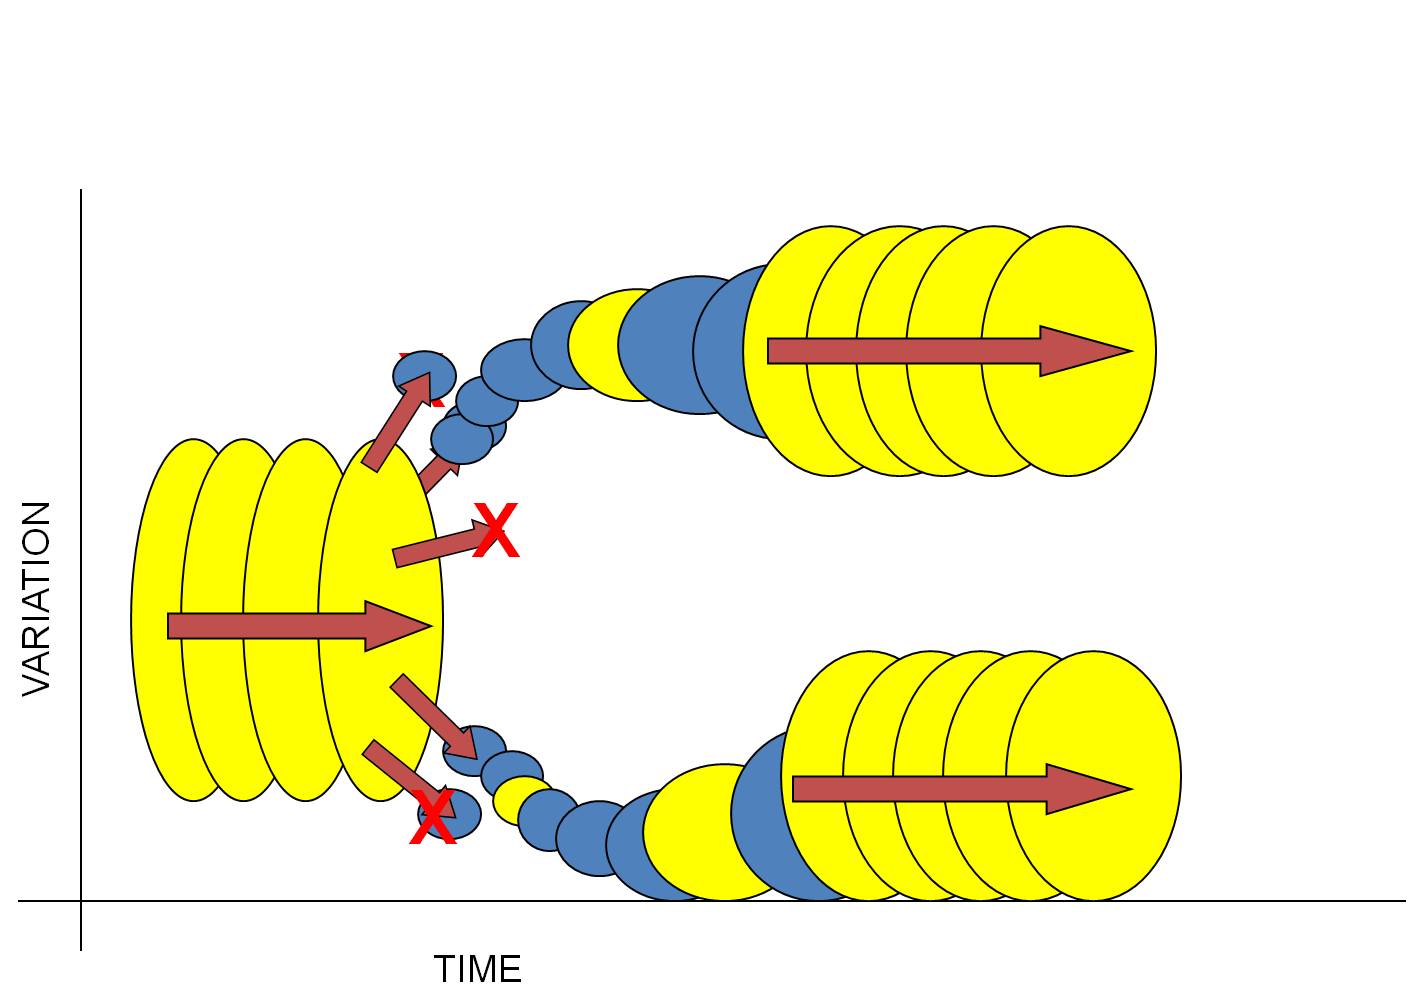
A ResolutionIf Mayr was correct in concluding that most evolutionary change should occur in small, isolated populations, then the discontinuous, punctuated pattern described by Eldridge and Gould naturally follows. Consider the following scenario:
1) Consider a large, well-adapted population. Indeed, these two characteristics often go hand in hand. "Well-adapted" means that the species is able to efficiently harvest energy from the environment and convert it effectively into offspring. So, large populations that reproduce successfully should be well adapted to their environment. And as long as the environment remains stable, then the effects of selection should be weak... most organisms have an adaptive genotype and there is little differential reproductive success among them. Likewise, if the population is large, then the effects of drift are small. So, a large, well-adapted population should change little over time (equilibrium). This is represented by the large yellow circles to the lef - the ancestral species - changing little over time.
2) Now insert Mayr's concept of peripatric speciation. Large populations often have a large geographical range. And if small populations 'bud-off' this large range into new habitats, then both drift (small populations of colonists) and natural selection (new habitat) will probably either change the genetic structure of the population rapidly, or cause the extinction of the population (because the narrow range of genetic variation contained in the small population of colonists is unable to tolerate the environmental conditions in the new habitat). This is represented by the small blue circles budding off last large yellow one.
3) So, most subpopulations colonizing new habitats will go extinct (this may be why the population didn't live there, in the first place). But occasionally, a small, genetically different subset may be able to tolerate the conditions in a new environment and persist. It will adapt rapidly to these new conditions, changing (evolving) rapidly as a consequence of drift and selection. These ideas are represented by some blue populations going extinct (red X), and others changing rapidly - a steep slope in variation over time.
4) Over these generations, when the population is small and changing in response to the environment, it is unlikely that each 'step' or 'transitional species' in this sequence will preserve a fossil. The populations are small (so it is unlikely that the rare event of fossilization will preserve a member of the species), and each morphologically distinct population is also short-lived; this will also reduce the chances that a member of the population gets fossilized (before it has evolved again). So, these small, rapidly changing populations are unlikely to each leave a fossil - and unfortunately, this may be just where the most evolutionary change is occuring in the lineage. (Yellow circles, both large and small, are the populations that leave a fossil.)
5) Now, as a population adapts to its new habitat, it should (almost by definition) become more effective at converting energy from the environment into successfully reproducing offspring. After all, this is what natural selection does - it increases the reproductive success of the population. So, as a population adapts to the environment, it should increase in size, too.
6) So, the population is becoming larger and better adapted to the environment. So, the effects of selection and drift should decline, and the rate of change should slow. Eventually, we have another species that is large and well-adapted to its environment, changing little over time. (The sequence of large yellow circles at the right of the figure).
This model of evolution explains Darwin's last dilemma - the apparent discontinuity of the fossil record. A modern understanding of evolution, that appreciates the effects of selection and drift acting on structural and regulatory genes, will cause rapid change in small populations and little change in well-adapted populations. Because fossilization is a rare event, small, short-lived populations will be far less likely to leave a fossil than a large, long-lived population. For this reason, because speciation is concentrated in local populations changing quickly, the fossil record will appear discontinuous. Rather than "explaining away" this discontinuity, Eldridge and Gould explained it as a necessary consequence of a modern understanding of the pattern and process of evolution.
Study Questions:
1) Why are similarities in non-coding regions particularly useful in reconstructing phylogenies? Refer to homology and analogy.
2) Explain the logic of using genetic differences and mutational clocks to determine the time since a common ancestor.
3) Does the fossil record conform to these predictions? Describe an example.
4)
Use the concepts of peripatric speciation and punctuated equilibrium to explain
why we don't have complete sequences of fossils that preserve every morphological
change that occurs in a lineage.